Introduction to Statistics and Geographic Data
Presenting Data
|
Histograms
Histograms are graphs that show the frequency of occurrences of values or ranges of values (bins). Histograms are one of the most important wa[AS1] ys to display datasets. Histograms allow us to ascertain the distribution of data and determine the probability of a value occurring. A special type of spatial histograms is directional histograms, also known as rose diagrams. Rose diagrams are directional frequency plots, using degrees from north as bins. 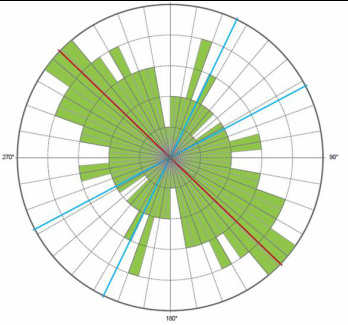
An example of a direction histogram created from stream data collected in eastern Utah.
|
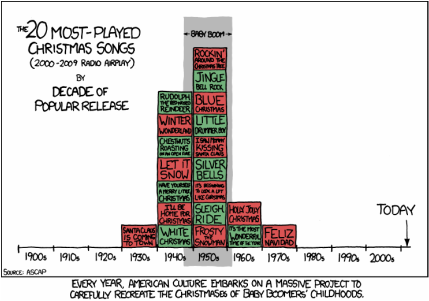
Histograms tell us how frequently things happen in different categories (bins). This histogram counts the frequency of hit Christmas songs for each decade, where the bins are decades.xkcd
 |
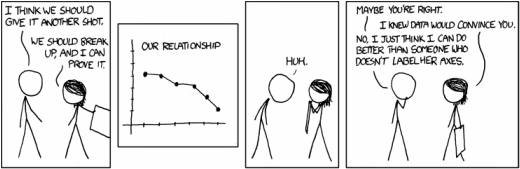
Scatter Plots
Scatter plots are point-based graphs that show the values 2 or 3 variables for a datapoint. An example is a map showing points with x and y coordinates. Scatterplots are good for visualizing correlation between two variables. Generally, on a scatterplot, the independent variable is on the x axis and the dependent variable is on the y axis.
Scatter plots are point-based graphs that show the values 2 or 3 variables for a datapoint. An example is a map showing points with x and y coordinates. Scatterplots are good for visualizing correlation between two variables. Generally, on a scatterplot, the independent variable is on the x axis and the dependent variable is on the y axis.